Scroll to:
Physical and mathematical model of the silicon vapor transport during high-temperature silicification of a porous carbon media
https://doi.org/10.17073/1997-308X-2024-3-49-61
Abstract
A new physical and mathematical model of silicon vapor transport under medium vacuum conditions has been developed, which makes it possible to explain the anomalously intense mass transfer of silicon during high-temperature silicification of a porous carbon material. A formula has been derived showing how the product must be supercooled in order for the condensation process to occur in its pores. The resulting modified diffusion equation makes it possible to determine quantitatively the flow of gaseous silicon into the sample, which is highly demanded in the implementation of the porous fiber carbidization technology and the subsequent complete saturation of the product pores with unreacted silicon. We introduce and quantify a new parameter, showing the contribution of convective transport to the overall mass transfer of silicon through an external gas medium, the role of which is played by argon. An exact analytical solution of the equation for silicon transfer in a one-dimensional formulation has been found for a layer of porous medium with a flat surface. The solution has the form of a logarithmic profile and allows us to calculate the flow of gaseous silicon at the entrance to the product. The proposed approach is demonstrated on the example of two-dimensional calculations performed by the finite difference method, however, the proposed model is easily generalized to the case of three-dimensional calculations with complex geometry, which always has to be dealt with in a real technological process. Calculations in a two-dimensional formulation have performed for two model systems: when the melt mirror and the product are parallel or perpendicular to each other. The dynamics of silicon vapor propagation in the retort has been studied. It is shown that in the conditions under consideration, gaseous silicon, after the onset of vaporization, fills the entire space of the retort in a characteristic time of less than 1 s.
For citations:
Ageeva M.V., Demin V.A., Demina T.V. Physical and mathematical model of the silicon vapor transport during high-temperature silicification of a porous carbon media. Powder Metallurgy аnd Functional Coatings (Izvestiya Vuzov. Poroshkovaya Metallurgiya i Funktsional'nye Pokrytiya). 2024;18(3):49-61. https://doi.org/10.17073/1997-308X-2024-3-49-61
Introduction
Currently, composite materials (CM) occupy a serious niche in all industries and are used both for manufacturing individual products and as coatings with special properties. CM unique properties account for their active use. In particular, CMs obtained by high temperature silicification of a porous carbon frame have high antioxidant properties, low density and, with the proper technique used, a high degree of tightness [1; 2]. Technologically, high temperature silicification is conducted under medium vacuum conditions in the inert carrier gas (argon) [3].
The attempts were earlier made to develop a complete physical and mathematical model for the vapor-phase silicification method, which included a quantitative description of the process of filling pores inside the sample and, in addition, solving the adjoint problem of silicon vapor transfer from the melt mirror to the product [4–6]. However, the authors of these works faced an unbridgeable gap between the calculation results and experimental data at the stage of numerical simulation of the diffusion transport of silicon vapor in the working space of the retort. The physical and mathematical model underlying the description of the process was based on the assumption that the main transfer mechanism is diffusion, and the concentration of silicon vapor on the melt mirror at a given operating temperature cannot exceed that of the saturated vapor. According to the diffusion equation solution, even if silicon is fully consumed on the surface of the sample, the vapor mass flow proves insufficient to completely siliconize the product within a reasonable time. The authors of [4–6] predicted that for silicon vapor to overcome the diffusion barrier in the form of an atmosphere of residual gas during silicification, the crucibles with the melt should be put as close to the product as possible, while in reality this factor is not decisive, and often some areas of a largesized product remain “dry”, despite the fact that the crucibles with molten silicon are located as close to the sample surface as possible.
Moreover, the experience shows that porous carbon matrices can be saturated with silicon, and various variants of this technique have long been commercially implemented in many manufacturing procedures. Thus, it is still very important to quantitatively determine the mass flow of silicon vapor through the blank surface for monitoring the manufacturing procedure when functional coatings are formed or the process of deep impregnation of a porous material is controlled.
All currently known modern techniques for producing high temperature CMs are continuously improved [7–9] and, due to their increasing complexity, require more advanced approaches at different implementation stages, including the construction of new physical and mathematical models to describe the processes occurring. Applied to real production conditions, the process of gaseous silicon transfer from the melt mirror to the product surface during high temperature silicification of a carbon porous material must be described by an elaborate system of partial differential equations, and its adequate simulation requires tracking of many complicating factors, including convective mass transfer [10]. At the same time, the technique is essentially three-dimensional and requires a highly detailed computational grid due to numerous crucibles with melt in the retort and their complex arrangement in the working space of the furnace [7]. At the moment, the fullfledged 3D numerical simulation of this process is impossible. As a result, the available models for describing the gaseous silicon transfer in the hearth of an industrial furnace during high temperature silicification are limited to elemental approaches. As this process is conducted in the medium vacuum and at extremely high temperatures above the silicon melting point (T > 1683 K), diffusion was believed to play a decisive role in ensuring the transfer of gaseous silicon from the melt to the product, and it was the only value taken into account in physical analysis-mathematical models [4–6].
The use of real values of the diffusion coefficient in the transfer equation does not ensure silicon supply in the amount required for full-fledged silicification of the product that can be experimentally observed. We face a paradoxical situation, since the facts speak for themselves: the experiments show that under certain conditions, a product can still be saturated with the required amount of silicon, but the existing theory denies this possibility. This means that we do not fully understand all physical conditions required for the successful implementation of the silicification process.
Thus, the objective of this work is to explain the experimentally observed abnormally strong transfer of gaseous silicon from the melt mirror to the product surface. The goal of the theoretical study is to construct a more advanced physical and mathematical model of the silicon vapor transfer in the working space of the retort. This model should be tested on the example of specific formulations to prove that it is more plausible compared to its purely diffusion analogue.
Analysis of basic equations
The equation of classical diffusion in a three-dimensional formulation [11], which is conventionally used to calculate the distribution of silicon vapor in a retort, looks as follows
\[\frac{{\partial C}}{{\partial t}} = D\left( {\frac{{{\partial ^2}C}}{{\partial {x^2}}} + \frac{{{\partial ^2}C}}{{\partial {y^2}}} + \frac{{{\partial ^2}C}}{{\partial {z^2}}}} \right)\,,\]
where D is the diffusion coefficient (assumed to be a constant) and C is the mass concentration. This is a wellknown second-order partial parabolic differential equation. In the stationary case (∂/∂t = 0), the problem is simplified and reduced to Laplace’s equation ΔC = 0.
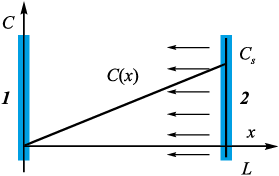
To begin with, without getting into specifics of the manufacturing method, it makes sense, following the study [10], to consider the process as a simple model, when the product surfaces and the melt are two parallel planes located at a distance L from each other (Fig. 1). Hereinafter we will neglect the effect of gravity. Suppose the concentration of saturated silicon vapor C(L) = Cs is specified on the melt mirror, while on the left boundary, as gaseous silicon is completely absorbed by the porous medium, the condition C(0) = 0 is maintained.
Fig. 1. Geometry of the problem |
In a one-dimensional formulation, Laplace’s equation with these boundary conditions leads to the only nontrivial solution in the form of a linear dependence
\[C(x) = \frac{{{C_s}}}{L}x\,,\]
which is schematically shown in Fig. 1. The characteristic distance L between the melt mirror and the product is about 0.5÷1.5 m.
According to the experimental data, the saturated vapor pressure for silicon at temperatures not much higher than the silicon melting point is very low and is equal in order of magnitude to ps = 10 Pa [12; 13]. The volumetric concentration for gaseous silicon in the saturated state is calculated based on the saturated vapor pressure using the gas equation. At an operating temperature is 1800 K, it gives a value of the order of ns ~ 4·1020 m\(^–\)3. Let us compare the theoretically predicted silicon flux density with the experimentally observed value. The silicon transfer is determined by diffusion only, however, in this case the silicon flux density is determined by Fick’s equation:
| \[{\bar j_{\rm{Si}}} = - \rho D\nabla C = - D\nabla {\rho _{\rm{Si}}}\,,\] | (1) |
where ρ is gas density and C is mass concentration. We will assess the diffusion coefficient of silicon atoms for medium vacuum conditions in an argon atmosphere using the wellknown formula of the molecular kinetic theory [14]:
| \[D = \frac{3}{8}\frac{{kT}}{{{\sigma _{12}}p}}\sqrt {\frac{{\pi kT}}{{2{\mu _{12}}}}} = \frac{3}{8}\frac{{{{\left( {kT} \right)}^{3/2}}}}{{d_{{\rm{Si}}}^{\rm{2}}p\sqrt {\pi {m_0}} }}.\] | (2) |
Where σ12 is a crosssection for scattering for two particles, μ12 is a reduced mass, and k is the Boltzmann constant. For two particles with approximately equal mass and size, we have σ12 = πd2, μ12 = m0 /2. The mass of one silicon atom is equal to m0 = 4.7·10\(^–\)26 kg. From the tabulated data we take the diameter of a silicon atom dSi = 2.3·10\(^–\)10 m. We thus obtain D = 0.7 m2/s. Such an unusually large value of the diffusion coefficient is attributed to two factors: the environment under the medium vacuum conditions is extremely rarified and the temperature is high.
Taking into account that the density of silicon on the melt mirror is ρSi = pSi μSi /(RT) = 1.87·10\(^–\)5 kg/m3, the formula (1) predicts a very low silicon flux density: jSi = 2.62·10\(^–\)5 kg/(m2·s). The industrial engineers specializing in silicification of carbon products claim that this is clearly not enough to completely block the pores within reasonable time, given the material porosity. However, in practice, if certain conditions experimentally determined by industrial engineers are met, products of various shapes are still successfully saturated with silicon. Thus, we can confidently state that all failures during the manufacturing procedure are determined by completely different factors, namely the temperature distribution throughout the product [15]. It is obvious that silicon vapor can transit from a gaseous state to a liquid or solid state only if the product temperature is lower than that of vapor [16–18]. After equalizing the temperature, in theory the process of silicification should stop due to condensation in the porous material. In this case, the surrounding gas and the product come into thermodynamic equilibrium. For a general understanding, let us calculate how much the product should be supercooled so that silicon is condensed on it. The boundary between two phases (vapor and liquid) is determined by the socalled Clapeyron–Clausius equation [19], which, as is known, is derived from the condition of continuity of the thermodynamic potential:
| \[\frac{{dP}}{{dT}} = \frac{q}{{T\left( {{v_1} - {v_2}} \right)}},{\rm{ }}{v_1} = \frac{{{V_1}}}{{{m_1}}},{\rm{ }}{v_2} = \frac{{{V_2}}}{{{m_2}}}.\] | (3) |
Where q is specific heat of the phase transition; P is gas pressure; T is temperature; v1 , v2 is specific volumes of vapor and liquid, respectively, m3/kg. It should be noted that for vapor and liquid the expression v1 \( \gg \) v2 is valid; so, the equation (3) can be simplified to
| \[\frac{{dT}}{{dP}} = \frac{{vT}}{q}.\] | (4) |
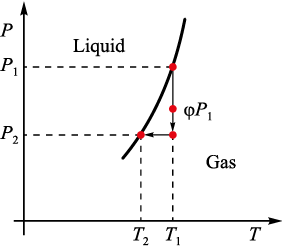
In the approximation under consideration, the index corresponding to the vapor specific volume is not required and it is omitted in further calculations. The phase transition curve is shown schematically in Fig. 2.
Fig. 2. P–T diagram of phase states |
We will assume that the actual conditions for silicon vapors during silicification are not far from the saturation state and correspond to temperature T1 . The transition to a supersaturated state at the same pressure obviously requires lower product temperature. Suppose the assumed saturated vapor pressure at temperature T1 is equal to P1 . Since in reality the vapor is not saturated, its real pressure is φP1, where φ is relative vapor humidity. In practice, with decreasing temperature, the vapor pressure automatically drops to the value P2 .
The gas volume and mass remain the same, so we get an isochoric process described by the equation
\[\frac{{{P_2}}}{{{T_2}}} = \frac{{\varphi {P_1}}}{{{T_1}}}.\]
In Fig. 2, the isochoric process is indicated by arrows, and the final state is characterized by the threshold pressure and temperature corresponding to the condensation point. Hence, we get the pressure in the final state: P2 = φP1 T2 /T1 .
On the other hand, at each point on the phase diagram, the gas state is described by the Mendeleev–Clapeyron equation, from which the specific volume can be derived from the vapor pressure and temperature:
| \[\frac{{PV}}{T} = \frac{{Rm}}{\mu },{\rm{ }}\frac{{Pv}}{T} = \frac{R}{\mu },{\rm{ }}v = \frac{{RT}}{{\mu P}}.\] | (5) |
where V is overall volume, μ molar mass, R is universal gas constant, and v is volume per unit mass. For the sake of clarity, we replace the derivative in the Clapeyron–Clausius equation (4) with finite differences, at the same time eliminating the specific volume using the equation (5):
| \[\frac{{{T_2} - {T_1}}}{{{P_2} - {P_1}}} = \frac{{v{T_1}}}{q},{\rm{ }}\frac{{{T_2} - {T_1}}}{{{P_2} - {P_1}}} = \frac{{RT_1^2}}{{q\mu {P_1}}}.\] | (6) |
It should be noted that, from a mathematical point of view, the derivative in the equation (6) represents the socalled onesided difference in point 1. Next, we substitute the expression for pressure P2 during the isoprocess in the equation (6) and derive the required temperature difference. The initial pressure P1 reduces in the resultant expression, and, at first glance, it seems strange that nothing depends on it. However, unambiguous complete information about the initial state of silicon vapor is still contained in this equation, since in addition to temperature it includes vapor relative humidity. Simple arithmetic operations enable to express the final temperature difference:
| \[{T_2} - {T_1} = \frac{{RT_1^2\left( {\varphi - 1} \right)}}{{\mu q - R{T_1}\varphi }}.\] | (7) |
The formula (7) shows that the temperature difference is negative, therefore, the product temperature should be lowered compared to the gas temperature. As an example, let us estimate the temperature difference for realistic parameter values: φ = 0.8, q = 13.8·106 J/kg, μ = 28·10\(^–\)3 kg/mol, T1 = 1790 K. The selected temperature T1 exceeds the silicon melting point by 102 K. It stays within the operating temperature range of the retort. The resulting equation is T2 – T1 = –15 K.
In other words, according to the calculations, the required temperature difference is small, but, the analysis of the thermophysical situation under industrial conditions reveals that this temperature factor is not controlled at all and this requirement is unlikely to be met in the fullscale manufacturing process. The estimates show that higher temperatures in the upper area of the working space inside the retort have an especially negative impact. This explains why, when largesized products are siliconized, their upper part is often less saturated with silicon than the lower part. The reason is that at the base of the product the temperature is much lower most of the time than in the upper area. All physical factors affecting uniform temperature distribution up and down the retort contribute to enhancing this stratification. The convection, the vacuum pumps located near the bottom, low thermal insulation at the base of the working space, side heaters positioned quite high from the base – all these factors result in a specific thermal stratification with a temperature gradient mostly directed upward vertically. Therefore, the temperature difference required by the formula (7) between silicon vapor and the product, can only occur near the lower boundary of the working space, if at all.
However, let us return to the truly pressing issue of supplying silicon vapor to the product, since it is clear that it must be solved regardless of the problem related to heat distribution in the retort during silicification.
New physical and mathematical model
of silicon vapor transfer
We will assume that under the conditions under consideration, there is an additional convective transport mechanism, along with the diffusive one. A more general equation for the transport of an impurity as a continuous medium, taking this factor into account [11], is written as follows
| \[\frac{{\partial C}}{{\partial t}} + \left( {\vec V\nabla } \right)C = D\Delta C,\] | (8) |
where \(\vec V\)is macroscopic (mass) speed of a physically small element of gas.
The main problem related to the use of the equation (8) is its closure. Within the framework of continuum mechanics, fluid dynamics are generally determined by the Navier–Stokes equation [11]. In the case of three-dimensional calculations, these are three nonlinear partial differential equations for three velocity components vi (x, y, z, t), where i = 1, 3. These equations include two more unknown quantities – pressure and variable density, which also has to be determined during the problem solution. As a result, two more equations are added to the system: conservation of mass in differential form and the equation of state. Thus, the resulting system of equations becomes extremely lengthy and difficult to solve.
Currently, direct numerical simulation of the processes under consideration in a full three-dimensional formulation is very difficult, even when high-performance supercomputers are used. The challenge is to formulate the problem in a simplified way so that two conditions are simultaneously met – on the one hand, all the physical factors relevant for an adequate description of these processes should be taken into account, and on the other hand, models should not be unnecessarily complex so that the problem could be calculated within a reasonable time and would not require excessive computing power.
Following the approach implemented in [10], we will consider the Navier–Stokes equation in its full formulation and evaluate the contribution of each term, assuming that gaseous silicon moves through the argon parent fluid as through a porous medium. In the hydrodynamics of porous media [20], it is important to distinguish between pore velocity \(\vec v\) and filtration velocity \({\bf{\vec \upsilon }}\). The filtration rate is determined through the total fluid flow rate and is connected with the pore velocity by the relation \({\bf{\mathord{\buildrel{\lower3pt\hbox{$\scriptscriptstyle\rightharpoonup$}} \over \upsilon } }} = \phi \vec v.\) Where ϕ is porosity of the material. For determining pore velocity in the medium, we use the initial motion equation [20]:
\[{\rho _f}\left( {\frac{{\partial \vec v}}{{\partial t}} + \left( {\vec v\nabla } \right)\vec v} \right) = - \nabla p - \frac{\eta }{\kappa }{\bf{\vec \upsilon }}.\]
Where ρf is density of the fluid moving through a porous medium, η is dynamic viscosity, κ is permeability and p pressure field. This equation assumes linear dependence of friction on the filtration rate. For simplicity, gravity is not taken into account. Coming over to the filtration rate, we get
| \[{\rho _f}\left( {{\phi ^{ - 1}}\frac{{\partial {\bf{\vec \upsilon }}}}{{\partial t}} + {\phi ^{ - 2}}\left( {{\bf{\vec \upsilon }}\nabla } \right){\bf{\vec \upsilon }}} \right) = - \nabla p - \frac{\eta }{\kappa }{\bf{\vec \upsilon }}.\] | (9) |
Now we can evaluate the terms related to speed on the left and right sides of this equation. The least trivial parameter in this equation is permeability κ. In our case, this is the permeability of argon gas with respect to the flow of silicon atoms. Regarding the mobile atoms of the carrier medium (argon), we can only talk about the model nature of this gas as a porous material with some effective permeability. We will keep in mind the model according to which gaseous silicon, as a kind of fluid, is filtered through a carrier medium as excessive amounts of silicon vapor emerge on the melt mirror and are absorbed at the opposite boundary. Due to the extreme rarefaction of the carrier medium, permeability κ is expected to be abnormally high. At the same time, the porosity is close to unity, since argon atoms, as scattering centers, occupy an extremely small volume.
Suppose the medium is a system of small solid spherical centers washed by a hydrodynamic flow. The interatomic distance in argon is equal in order of magnitude to the freepath length of
\[l = \frac{{kT}}{{\sqrt 2 \pi {d^2}p}} = \frac{{1.38 \cdot {{10}^{ - 23}} \cdot 1800}}{{\sqrt 2 \pi {{\left( {1.4 \cdot {{10}^{ - 10}}} \right)}^2} \cdot 100}} = 5.6 \cdot {10^{ - 3}}{\rm{ m}}.\]
The argon atom diameter is d = 1.4·10\(^–\)10 m. According to the manufacturing procedure, argon partial pressure is on the order of 100 Pa. The resulting equation for permeability is κ ~ l2 = 3.1·10\(^–\)5 m2.
However, this assessment gives a slightly underestimated permeability value, since it is valid in the case of dense packing of obstacles. For a more accurate estimate, we will use the wellknown Kozeny–Karman formula [20]. This formula is widely used in the theory of porous media and is derived from the most general geometric considerations. As a result, we get
\[\kappa = \frac{{{\phi ^3}{d^2}}}{{{{\left( {1 - \phi } \right)}^2}}} = 5 \cdot {10^{ - 4}}{\rm{ m}}{{\rm{}}^{\rm{2}}}.\]
Where ϕ is porosity of the carrier medium (argon) and d is characteristic size of the streamlined obstacle (in our case, these are argon atoms).
Another important parameter is the macroscopic velocity of the gas element (filtration rate). We will assume that during evaporation, silicon atoms separate from the melt surface with a rootmean-square velocity, which amounts to ~1250 m/s at T = 1800 K. Averaging over all possible directions, we obtain the value of the velocity projection onto the normal (filtration speed) v ~ 310 m/s. Now let us assess the value of each term in the equation (9), taking into account that the porosity of such a medium is close to unity and that stationary motion is considered (∂/∂t = 0):
\[\begin{array}{c}\left| {{\rho _f}{\phi ^{ - 2}}\left( {{\bf{\vec \upsilon }}\nabla } \right){\bf{\vec \upsilon }}} \right| \sim {\rho _f}\frac{{{{\bf{\upsilon }}^2}}}{L} = 2 \cdot {10^{ - 5}}\frac{{{{310}^2}}}{{0.5}} = 3.8,\\\left| {{\rho _f}{\phi ^{ - 1}}\frac{{\partial {\bf{\vec \upsilon }}}}{{\partial t}}} \right| = 0,{\rm{ }}\left| {\frac{{\eta {\bf{\vec \upsilon }}}}{\kappa }} \right| = \frac{{3.5 \cdot {{10}^{ - 4}} \cdot 310}}{{5 \cdot {{10}^{ - 4}}}} = 217.\end{array}\]
These estimates show that the viscosity term is dominant in this equation. Namely: both the inertia term and the term that expresses nonstationarity of processes are negligible compared to the viscosity term:
\[\left| {\frac{{\eta {\bf{\vec \upsilon }}}}{\kappa }} \right| \gg \left| {{\rho _f}{\phi ^{ - 2}}\left( {{\bf{\vec \upsilon }}\nabla } \right){\bf{\vec \upsilon }}} \right|.\]
Therefore, we derive the formula for speed in the form of the wellknown Darcy’s law [20] from the equation [20]:
| \[{\bf{\vec \upsilon }} = - \frac{\kappa }{\eta }\nabla {p_{\rm{Si}}}.\] | (10) |
Due to evaporation on the melt mirror and absorption on the product, we get an average silicon vapor density gradient. The gas pressure is generally proportional to density, which generates a silicon pressure gradient and it can act as an additional driving force along with diffusion. According to the gas equation, the silicon partial pressure is equal to pSi = nSikT, where nSi = NSi /V is the number of silicon atoms per unit volume. Let us express nSi in terms of the mass concentration C. By definition, by mass concentration we mean
\[C = \frac{{{m_{\rm{Si}}}}}{{{m_{\rm{а}}} + {m_{\rm{Si}}}}} = \frac{{{\rho _{\rm{Si}}}}}{{{\rho _{\rm{а}}} + {\rho _{\rm{Si}}}}},\]
then the silicon density is expressed in terms of relative mass concentration as follows:
| \[{{\rm{\rho }}_{\rm{Si}}} = \frac{C}{{1 - C}}{{\rm{\rho }}_{\rm{а}}}.\] | (11) |
Let us write the equation for the silicon partial pressure in terms of the silicon density and substitute the formula (11) in it:
| \[{p_{\rm{Si}}} = \frac{{RT}}{{{\mu _{\rm{Si}}}}}\frac{C}{{1 - C}}{{\rm{\rho }}_{\rm{а}}}.\] | (12) |
Next, let us substitute this result into the Darcy’s law (10), neglecting the spatial inhomogeneities of argon density and temperature in the retort. Let us also take into account the fact that the silicon concentration never actually reaches unity. Argon or residual air is always present in the retort, and their concentration is approximately an order of magnitude higher than that of silicon vapor. Eventually, we expand the factor C/(1 – C) into a series in small C and limit our final formula to the first non-vanishing term. The Darcy’s law (10) takes the form
| \[{\bf{\vec \upsilon }} = - \frac{\kappa }{\eta }\nabla {p_{\rm{а}}} = - \frac{\kappa }{\eta }\frac{{RT{\rho _{\rm{Si}}}}}{{{\mu _{\rm{Si}}}}}\nabla C.\] | (13) |
However, the equation (8) includes the average mass velocity
\[\vec V = \frac{{{\rho _{\rm{a}}}{{{\bf{\vec \upsilon }}}_{\rm{a}}} + {\rho _{\rm{Si}}}{{{\bf{\vec \upsilon }}}_{\rm{Si}}}}}{{{\rho _{\rm{a}}} + {\rho _{\rm{Si}}}}} = \frac{{{\rho _{\rm{Si}}}{{{\bf{\vec \upsilon }}}_{\rm{Si}}}}}{{{\rho _{\rm{a}}} + {\rho _{\rm{Si}}}}} \approx \frac{{{\rho _{\rm{Si}}}{{{\bf{\vec \upsilon }}}_{\rm{Si}}}}}{{{\rho _{\rm{a}}}}}.\]
We substitute (13) into this formula, exclude the velocity from the extended impurity transfer equation (8) and end up with the equation
| \[\frac{{\partial C}}{{\partial t}} - \frac{{\kappa RT{\rho _{\rm{Si}}}}}{{\eta {\mu _{\rm{Si}}}}}{\left( {\nabla C} \right)^2} = D\Delta C.\] | (14) |
Now this is a more complex partial differential equation with a nonlinearity like the square of the concentration gradient, but for one variable C(x, y, z, t). It should be noted that similar diffusion equations with nonlinearities, quadratic function of the concentration gradient, are found in various fields of physics, but are derived differently. Thus, the studies [21; 22] showed that a nonlinear term of this type changes the material (lithium niobate) transport diffusion properties quite significantly and enables to explain some of the observed effects associated with the medium under consideration being saturated with hydrogen. In the general case, the equation (14) enables to solve non-stationary problems of concentration distribution in a three-dimensional formulation.
Analytical solution
First of all, it makes sense to analyze the equation (14) for the stationary solution. Given that ∂/∂t = 0, the equation (14) is reduced to the form
| \[ - \left( {\nabla C} \right) = \psi \Delta C,{\rm{ }}\psi = \frac{{\eta {\mu _{\rm{Si}}}D}}{{\kappa RT{\rho _{\rm{Si}}}}},\] | (15) |
where ψ is a new dimensionless parameter. Let us estimate the value of the introduced parameter, which loosely determines the relationship between diffusive and convective mechanisms. Let us take the value of dynamic viscosity from [10]. In the work mentioned above, this parameter was assessed in relation to the silicification process under consideration, based on the wellknown formulas of molecular kinetic theory [14]:
\[\frac{{\eta = \frac{1}{3}{{\left( {\frac{2}{\pi }} \right)}^{3/2}}{{\left( {{m_0}kT} \right)}^{1/2}}}}{{d_{{\rm{Ar}}}^2}} = 3.5 \cdot {10^{ - 4}}{\rm{ }}{{\rm{m}}^{\rm{2}}}{\rm{/s}}{\rm{.}}\]
Assessment of the parameter ψ for the permeability value κ = 5·10\(^–\)4 m2 results in ψ = 0.048. This means that, under the conditions under consideration, convective transport significantly contributes to silicon vapor transport.
In the one-dimensional formulation with regard to the geometry of the problem presented in Fig. 1, the equation (15) has an exact solution. Namely, let us formulate the boundary value problem for the unknown function C(x) in the form of an ordinary second-order differential equation and two boundary conditions:
\[ - \left( {\frac{{dC}}{{dx}}} \right) = \psi \frac{{{d^2}C}}{{d{x^2}}};{\rm{ }}C(0) = 0,{\rm{ }}C(L) = {C_s}{\rm{.}}\]
By substituting a variable, the order of the equation is reduced, and then the elementary equation is integrated [23]. As a result, taking into account the abovementioned homogeneous boundary conditions, we obtain the logarithmic dependence
| \[C(x) = \psi \ln \left\{ {\frac{x}{L}\left[ {\exp \left( {\frac{{{C_s}}}{\psi }} \right) - 1} \right] + 1} \right\}.\] | (16) |
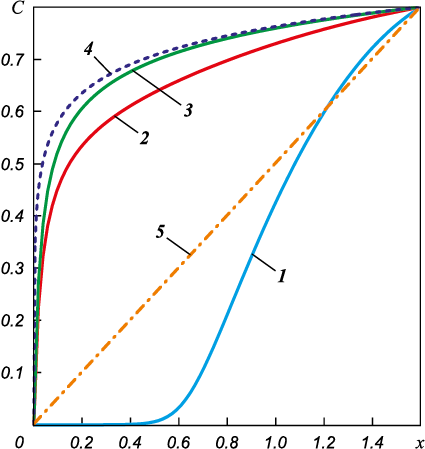
For completeness, we can calculate the derivative of this solution on the left boundary. With this derivative value, the silicon vapor flux density is an order of magnitude higher than in the case of purely diffusive transfer: jSi = 3.0·10\(^–\)4 kg/(m2·s). Let us present as an example a dependency graph C(x) for L = 1.6 m. Now the solution is a convex function. Fig. 3 (curve 4) shows that the largest derivative is right on the left boundary of the range of definition, i.e. on the product surface. The flux density is proportional to the magnitude of the derivative. Thus, to explain the high rate of high temperature saturation of carbon material in the medium vacuum observed in experiments, we should take into account the independent convective transport of silicon vapor in addition to diffusive transport. Moreover, silicon vapor now fills almost the entire working space of the retort. It is only in a thin boundary layer near the product itself that the concentration of silicon vapor tends to zero due to the assumed complete absorption. It is well consistent with the data of the fullscale experiment in the sense that silicon condensation can be intensive within the retort in places much removed from the crucibles.
Fig. 3. Evolution of concentration profile for different moments of time |
One-dimensional non-stationary solution
Let us now make calculations to solve a non-stationary problem. The one-dimensional solution will be our primary interest.
The equation (14) is nonlinear, so the easiest way to obtain its non-stationary solution is numerical, using the finite difference method [24]. Sampling schemes of first-order accuracy were used to approximate derivatives in both time and space. First order accuracy for spatial derivatives with “backward differences” was used to ensure the stability of the difference scheme. The program code was implemented in the FORTRAN-90 language. The number of nodes along the spatial coordinate was taken to be N = 85.
The dynamics of the concentration front presented for different sampling times in Fig. 3 shows that the solution quite quickly reaches a steady stationary profile in the form of the previously described convex function (the graphs were obtained for L = 1.6 m). The calculation results show that it takes ~2 s to reach the stationary profile. At first, silicon vapor is only observed at the melt mirror (curve 1 in Fig. 3). Then, very quickly, silicon fills the entire space inside the retort (Fig. 3, curve 2, 3). At the moment of defining (Fig. 3, curve 4), the largest derivative is on the left boundary of the range of definition, i.e. on the product surface. The numerical solution of the generalized equation of silicon vapor diffusion during silicification of a porous carbon material obtained in the course of this study shows that gaseous silicon quickly occupies almost the entire volume of the furnace working space. In other words, contrary to longheld belief based on the findings of previous theoretical works [4–6], there is no need to bring crucibles with molten silicon as close to the product surface as possible.
Calculations in two-dimensional formulation
The next most difficult stage is to conduct numerical simulation in a two-dimensional formulation. These calculations were also performed using the finite difference method. The classic explicit scheme was implemented [24]. During the calculations, a spatially uniform rectangular grid was used with a breakdown of 85:41 (85 nodes on the x coordinate between the melt mirror and the sample, 41 nodes on the y coordinate along the product surface). The larger number of nodes along the x axis is twice as large because the boundary layer has to be resolved near the product at the final stage of defining. The height of the sample is H = 0.4 m, the distance from the melt to the product is L = 0.6 m. The condition of impermeability was set for the upper and lower faces. As for the one-dimensional formulation, sampling schemes of first-order accuracy were used to approximate the time and space derivatives. To ensure the stability of the difference scheme, the derivatives with respect to the “flux” had first order accuracy and were calculated as “backward differences”. Now the silicon vapor transfer is described by the following non-stationary equation:
| \[\frac{{\partial C}}{{\partial t}} - {D_c}\left[ {{{\left( {\frac{{\partial C}}{{\partial x}}} \right)}^2} + {{\left( {\frac{{\partial C}}{{\partial y}}} \right)}^2}} \right] = D\left( {\frac{{{\partial ^2}C}}{{\partial {x^2}}} + \frac{{{\partial ^2}C}}{{\partial {y^2}}}} \right).\] | (17) |
This equation includes two dimensional modifiers. Implicitly one of them is the convective transport parameter:
| \[{D_c} = \frac{{\kappa RT{\rho _{\rm{Si}}}}}{{\eta {\mu _{\rm{Si}}}}},\] | (18) |
the second is the diffusion coefficient D; their dimensions are the same, m2/s. The first parameter describes the convective transport mechanism, while the second one is purely diffusive. Now (17) is a two-dimensional non-stationary partial differential equation with the same nonlinearity like the square of the concentration gradient. Calculations were performed for L = 0.6 m (array length), H = 0.4 m (sample height), Dc = 57.1 m2/s (convective parameter), D = 0.7 m2/s (diffusion coefficient). Initially, there are no silicon vapors in the space inside the retort. The constant concentration value corresponding to saturation is set on the right boundary and the condition of complete absorption is defined on the left boundary.
Results and discussion
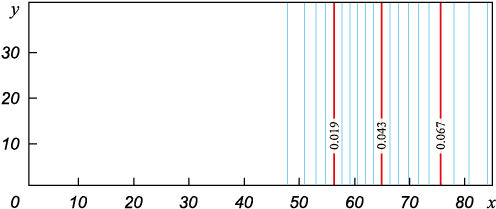
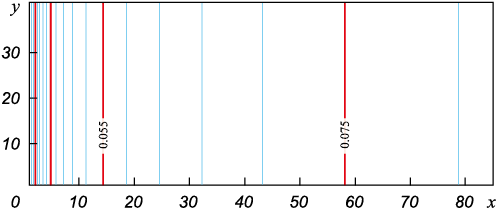
The dynamics of the concentration front presented for different sampling times in Fig. 4 and 5 shows that the solution quite quickly reaches a steady stationary profile in the form of a convex surface, as in the one-dimensional case. At the initial stage lasting for milliseconds, silicon vapors are present on the right near the melt mirror only (Fig. 4). Further, the retort space fills with vapor and the concentration profile steepens. It should be noted that the concentration front remains flat all the time as it moves towards the product surface.
Fig. 4. Isolines of silicon vapour concentration at initial stage for t = 0.004 s
Fig. 5. Isolines of silicon vapour concentration at steady stage for t = 1.0 s |
The calculations show that it takes ~0.5 s to reach the stationary profile. The largest derivative at the final stage of defining (Fig. 5) is still on the left boundary of the range of definition, i.e. on the product surface. It should be kept in mind that the flux density is proportional to the derivative value in this point. Thus, taking into account the independent convective transport of silicon vapor in addition to diffusive transport, we confirm the rather high rate of high temperature saturation of carbon material observed in experiments in the medium vacuum, which contradicts the value of the silicon flux from the classical diffusion equation.
Thus, it should be emphasized once again that a large sized product can not be sufficiently saturated with silicon during the experiment only due to improper thermophysical mode of the entire process determined by the design features of the furnace.
These negative factors were earlier discussed in [15]. It was demonstrated that complete silicification of a product within a reasonable time is quite possible. In other words, the primary chemical reaction of carbon fiber carbonization and further condensation of silicon vapor in the pores of the material require a technique with more strict temperature control on the product surface rather than rearrangement of crucibles. If the sample surface is parallel to the melt mirror, as was assumed in the original formulation, the streamlines of silicon macroscopic motions are straight trajectories perpendicular to these surfaces. In this case, the wavefront of silicon vapor is stable, flat at any specific time and moves from the melt to the product so that the condition of homogeneity along the y coordinate can be used. However, in practice, in the gravity field, the surface of the melt mirror is always horizontal, since the silicon melt is in crucibles. At the same time, the product is placed vertically in the retort at some distance from the crucibles (there can be several of those). As a result, it is important to understand whether the nature of the silicon vapor distribution in the retort will change with more complex mutual arrangements of the source of silicon vapor and the absorbing surface.
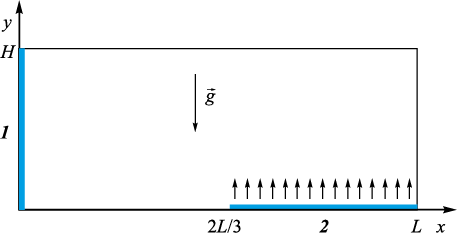
Let us now analyze a more realistic configuration in the form of a rectangular retort shown in Fig. 6, with a silicon absorbing left vertical boundary 1 and a horizontal melt mirror 2 located at a distance of 2L/3 from the sample. The melt surface itself has a size of L/3. The condition of impermeability is set for all other areas of the retort.
Fig. 6. Configuration for horizontal linear source of silicon vapour |
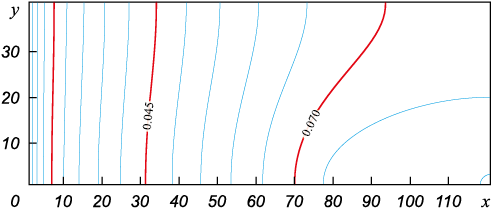
The calculation was performed on a 121:41 grid. The height of the sample was H = 0.4 m, the length of the range of definition was L = 1.2 m. At this proportion, the size of the melt mirror is Δ = 0.4 m. The results of the numerical simulation of the system in this configuration are presented in Fig. 7, 8 for two points in time: at the defining stage (at t = 0.005 s) and in the final state, close to stationary (t = 0.1 s). It can be seen that a stationary distribution is established in the system almost as quickly as in the previous configuration (within about 1 s). The calculations also show that silicon still occupies almost the entire working space inside the retort, with the exception of a relatively thin boundary layer near the absorbing surface area. Fig. 7, 8 show that silicon vapors propagate with almost the same intensity in all directions from the melt mirror. Silicon atoms need almost the same time to reach the product surface as in the previous case, when the surfaces were parallel to each other.
Fig. 7. The field of silicon concentration
Fig. 8. The field of silicon concentration |
The calculation results show that the rarefied gas (argon), through which silicon vapors from the melt mirror penetrate to the sample, is not in itself the main restraining factor limiting the silicon mass transfer. In any case, different mutual arrangements of the silicon vapor source and the absorbing surface do not considerably change the time for reaching the stationary state.
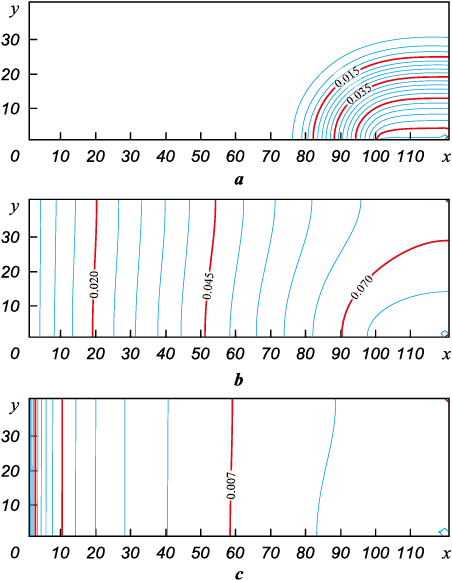
A much more serious modifier in the problem is the relationship of the areas of the evaporating and absorbing surfaces. Let us now reduce the linear size of the surface on which evaporation takes place to Δ = 0.2 m, leaving unchanged the product height H = 0.4 m and the retort length L = 1.2 m. All other parameters will remain the same. Isolines and two-dimensional surfaces of the concentration field for this situation are presented in Fig. 9, a, b.
Fig. 9. The field of silicon concentration for horizontal source of the vapour at Δ = 0.2 m |
Fig. 9, a shows the initial moment of time, when the vapors have not yet spread to the entire volume. However, Fig. 9, b demonstrates that with smaller sizes of the melt mirror (twice the difference compared to the previous case) at t = 0.1 s, the stationary state is not reached yet.
Calculations show that the concentration profile now requires approximately twice as much time to set the stationary mode as in the previous case. The concentration field for the melt mirror at t = 1.0 s is shown in Fig. 9, c. Further on, the concentration field practically ceases to change over time. This result is physically understandable, since filling the space inside the retort with silicon vapor requires a certain time, and it is directly related to the amount of silicon evaporating per time unit from the source surface. As the melt mirror length decreases, this time expectedly increases in proportion to it.
Conclusion
The analytical and numerical solutions of the generalized equation of silicon vapor diffusion during silicification of a porous carbon material obtained in the course of this study show that gaseous silicon quickly occupies almost the entire volume of the furnace working space. In other words, contrary to longheld belief based on the findings of previous theoretical works, there is no need to bring crucibles with molten silicon as close to the product surface as possible.
The results obtained from the two-dimensional formulation confirm the similar data received in the one-dimensional case. They show that the resistance of foreign gases to the silicon diffusion flow should certainly be present in the real production environment, but classical diffusion is not the only transfer mechanism. Generalization of the model taking into account additional convective transfer enables to solve the paradox of anomalously intense saturation of porous carbon material with silicon vapor in the experiment, in contradiction to earlier theoretical predictions.
References
1. Chawla Krishan K. Composite materials. Science and engineering. N.Y.: Springer, 2012. 542 p.
2. Shang J. Durability testing of composite aerospace materials based on a new polymer carbon fiber-reinforced epoxy resin. Fluid Dynamics & Material Processing. 2023;19(9): 2315–2327. https://doi.org/10.32604/fdmp.2023.026742
3. Shikunov S.L., Kurlov V.N. SiC-based composite materials obtained by siliconizing carbon matrices. Journal of Technical Physics. 2017;62(12):1869–1876. https://doi.org/10.1134/S1063784127120222
4. Garshin A.P., Kulik V.I., Matveev S.A., Nilov A.S. Modern technologies for the production of fiber-reinforced composite materials with a ceramic refractory matrix. Novye Ogneupory (New Refractories). 2017;(4):20–35. (In Russ.).
5. Kulik V.I., Kulik A.V., Ramm M.S., Demin S.E. Development of a model and numerical study of the processes for production composites with a SiC matrix by vapour-phase siliconization. In: Proc. of the IV Intern. Conf. “Functional nanomaterials and high-purity substances” (Suzdal, 1–5 Oct. 2012). Moscow: Institute of Metallurgy and Materials Science, 2012. P. 240–242. (In Russ.).
6. Kulik V.I., Kulik A.V., Ramm M.S., Demin S.E. Numerical study of gradient CVI processes for production of SiC-matrix composites. In: Proc. of the V Intern. Conf. “Functional nanomaterials and high-purity substances” (Suzdal, 6–10 Oct. 2014). Moscow: Institute of Metallurgy and Materials Science, 2014. P. 128–129. (In Russ.).
7. Shchurick A.G. Artificial carbon materials. Perm: UNIIKM Publ., 2009. 342 p. (In Russ.).
8. Timofeev A.N., Razina A.S., Timofeev P.A., Bodyan A.G. Calculating the penetration depth of reaction in chemical gas-phase deposition of boron nitride within porous bodies. Powder Metallurgy аnd Functional Coatings. 2023;17(3): 38–46. https://doi.org/10.17073/1997-308X-2023-3-38-46
9. Pogozhev Yu.S., Potanin A.Yu., Rupasov S.I., Levashov E.A., Volkova V.A., Tashev V.P., Timofeev A.N. Structure, properties and oxidation resistance of prospective HfB2–SiC based ceramics. Russian Journal of Non-Ferrous Metals. 2020;61(6):704–715. https://doi.org/10.17073/ 1997-308X-2020-3-41-54
10. Demin V.A., Demina T.V., Maryshev B.S. Physical and mathematical model of gaseous silicon transfer during high-temperature siliconization of carbon composite materials. Bulletin of Perm University. Physics. 2022;(3):48–55. (In Russ.). https://doi.org/10.17072/1994-3598-2022-3-48-55
11. Landau L.D., Lifshits E.M. Course of theoretical physics. Vol. 6. Hydrodynamics. Moscow: Fizmatlit, 2001. 736 p. (In Russ.).
12. Sevast’yanov V.G., Nosatenko P.Ya., Gorskii V.V., Ezhov Yu.S., Sevast’yanov D.V., Simonenko E.P., Kuznetsov N.T. Experimental and theoretical determination of the saturation vapour pressure of silicon in a wide range of temperatures. Russian Journal of Inorganic Chemistry. 2010;13(55):2073–2088.
13. Tomooka T., Shoji Y., Matsui T. High temperature vapor pressure of Si. Journal of the Mass Spectrometry of Japan. 1999;47(1):49–53. https://doi.org/10.5702/ massspec.47.49
14. Hirschfelder J.O., Curtiss Ch.F., Bird R.B. Molecular theory of gases and liquids. N.Y.: Wiley & Sons, 1954. 1219 p.
15. Ageeva M.V., Demin V.A. Physical model and numerical simulation of high-temperature silicification of carbon composite material. Philosophical Transactions of the Royal Society A. 2023;381:20220083. https://doi.org/10.1098/rsta.2022.0083
16. Matsumoto M. Molecular dynamics simulation of interphase transport at liquid surfaces. Fluid Phase Equilibria. 1996;(125):195–203.
17. Matsumoto M. Molecular dynamics of fluid phase change. Fluid Phase Equilibria. 1998;(144):307–314.
18. Bond M., Struchtrup H. Mean evaporation and condensation coefficients based on energy dependent condensation probability. Physical Review E 70. 2004;061605. https://doi.org/10.1103/PhysRevE.70.061605
19. Schwabl Fr. Statistical mechanics. Berlin: Springer, 2006. 577 p.
20. Nield D.A., Bejan A. Convection in porous media. N.Y.: Springer, 2006. 654 p.
21. Demin V.A., Petukhov M.I., Ponomarev R.S., Topova A.V. Nonlinear sorptive effects during the pumping of nanofluid through porous medium. Bulletin of Perm University. Physics. 2021;(1):49–58. (In Russ.). https://doi.org/10.17072/1994-3598-2021-1-49-58
22. Vohra S.T., Mickelson A.R., Asher S.E. Diffusion characteristics and waveguiding properties of proton exchanged and annealed LiNbO3 channel waveguides. Journal of Applied Physics (AIP). 1989;66(11):5161–5174. https://doi.org/10.1063/1.343751
23. Korn G.A., Korn T.M. Mathematical handbook for scientists and engineers. Dover Publications, 2013. 1615 p.
24. Samarskii A.A. The theory of difference schemes. N.Y.: Marcel Dekker, Inc., 2001. 762 p.
About the Authors
M. V. AgeevaRussian Federation
Maria V. Ageeva – Research Engineer at the Laboratory of Underground Sequestration of Carbon at the Institute of Continuous Media Mechanics of the UB RAS; Master’s Student at the Perm State National Research University (PSNRU)
15 Bukirev Str., Perm 614068, Russia
29 Komsomolskiy Prosp., Perm 614990, Russia
V. A. Demin
Russian Federation
Vitaly A. Demin – Dr. Sci. (Phys.-Math.), Prof., Head of Theoretical Physics Department at the PSNRU; Prof. at the Department of General Physics at the Perm National Research Polytechnic University
15 Bukirev Str., Perm 614068, Russia
1 Korolev Str., Perm 614013, Russia
T. V. Demina
Russian Federation
Tatyana V. Demina – Research Engineer at the Laboratory of Underground Sequestration of Carbon at the Institute of Continuous Media Mechanics of the UB RAS; Postgraduate Student at the PSNRU
15 Bukirev Str., Perm 614068, Russia
29 Komsomolskiy Prosp., Perm 614990, Russia
Review
For citations:
Ageeva M.V., Demin V.A., Demina T.V. Physical and mathematical model of the silicon vapor transport during high-temperature silicification of a porous carbon media. Powder Metallurgy аnd Functional Coatings (Izvestiya Vuzov. Poroshkovaya Metallurgiya i Funktsional'nye Pokrytiya). 2024;18(3):49-61. https://doi.org/10.17073/1997-308X-2024-3-49-61


